How to leverage charts to showcase form responses
You can use charts for a variety of purposes such as data analysis and decision making. In this article, you’ll learn how you can leverage charts to showcase form responses and what type of chart is created for each field in your forms.
.png)

You can use charts for a variety of purposes such as data analysis and decision making. In this article, you’ll learn how you can leverage charts to showcase form responses and what type of chart is created for each field in your forms.
Forms help you collect information from your audience. The first tools that come in handy to understand your collected information, are charts.
You can use charts for a variety of purposes such as data analysis and decision-making. In this article, you’ll learn what charts you can get from each field in your forms.
You can showcase your responses and charts using Formaloo’s Presentation mode.
Single-Choice Field
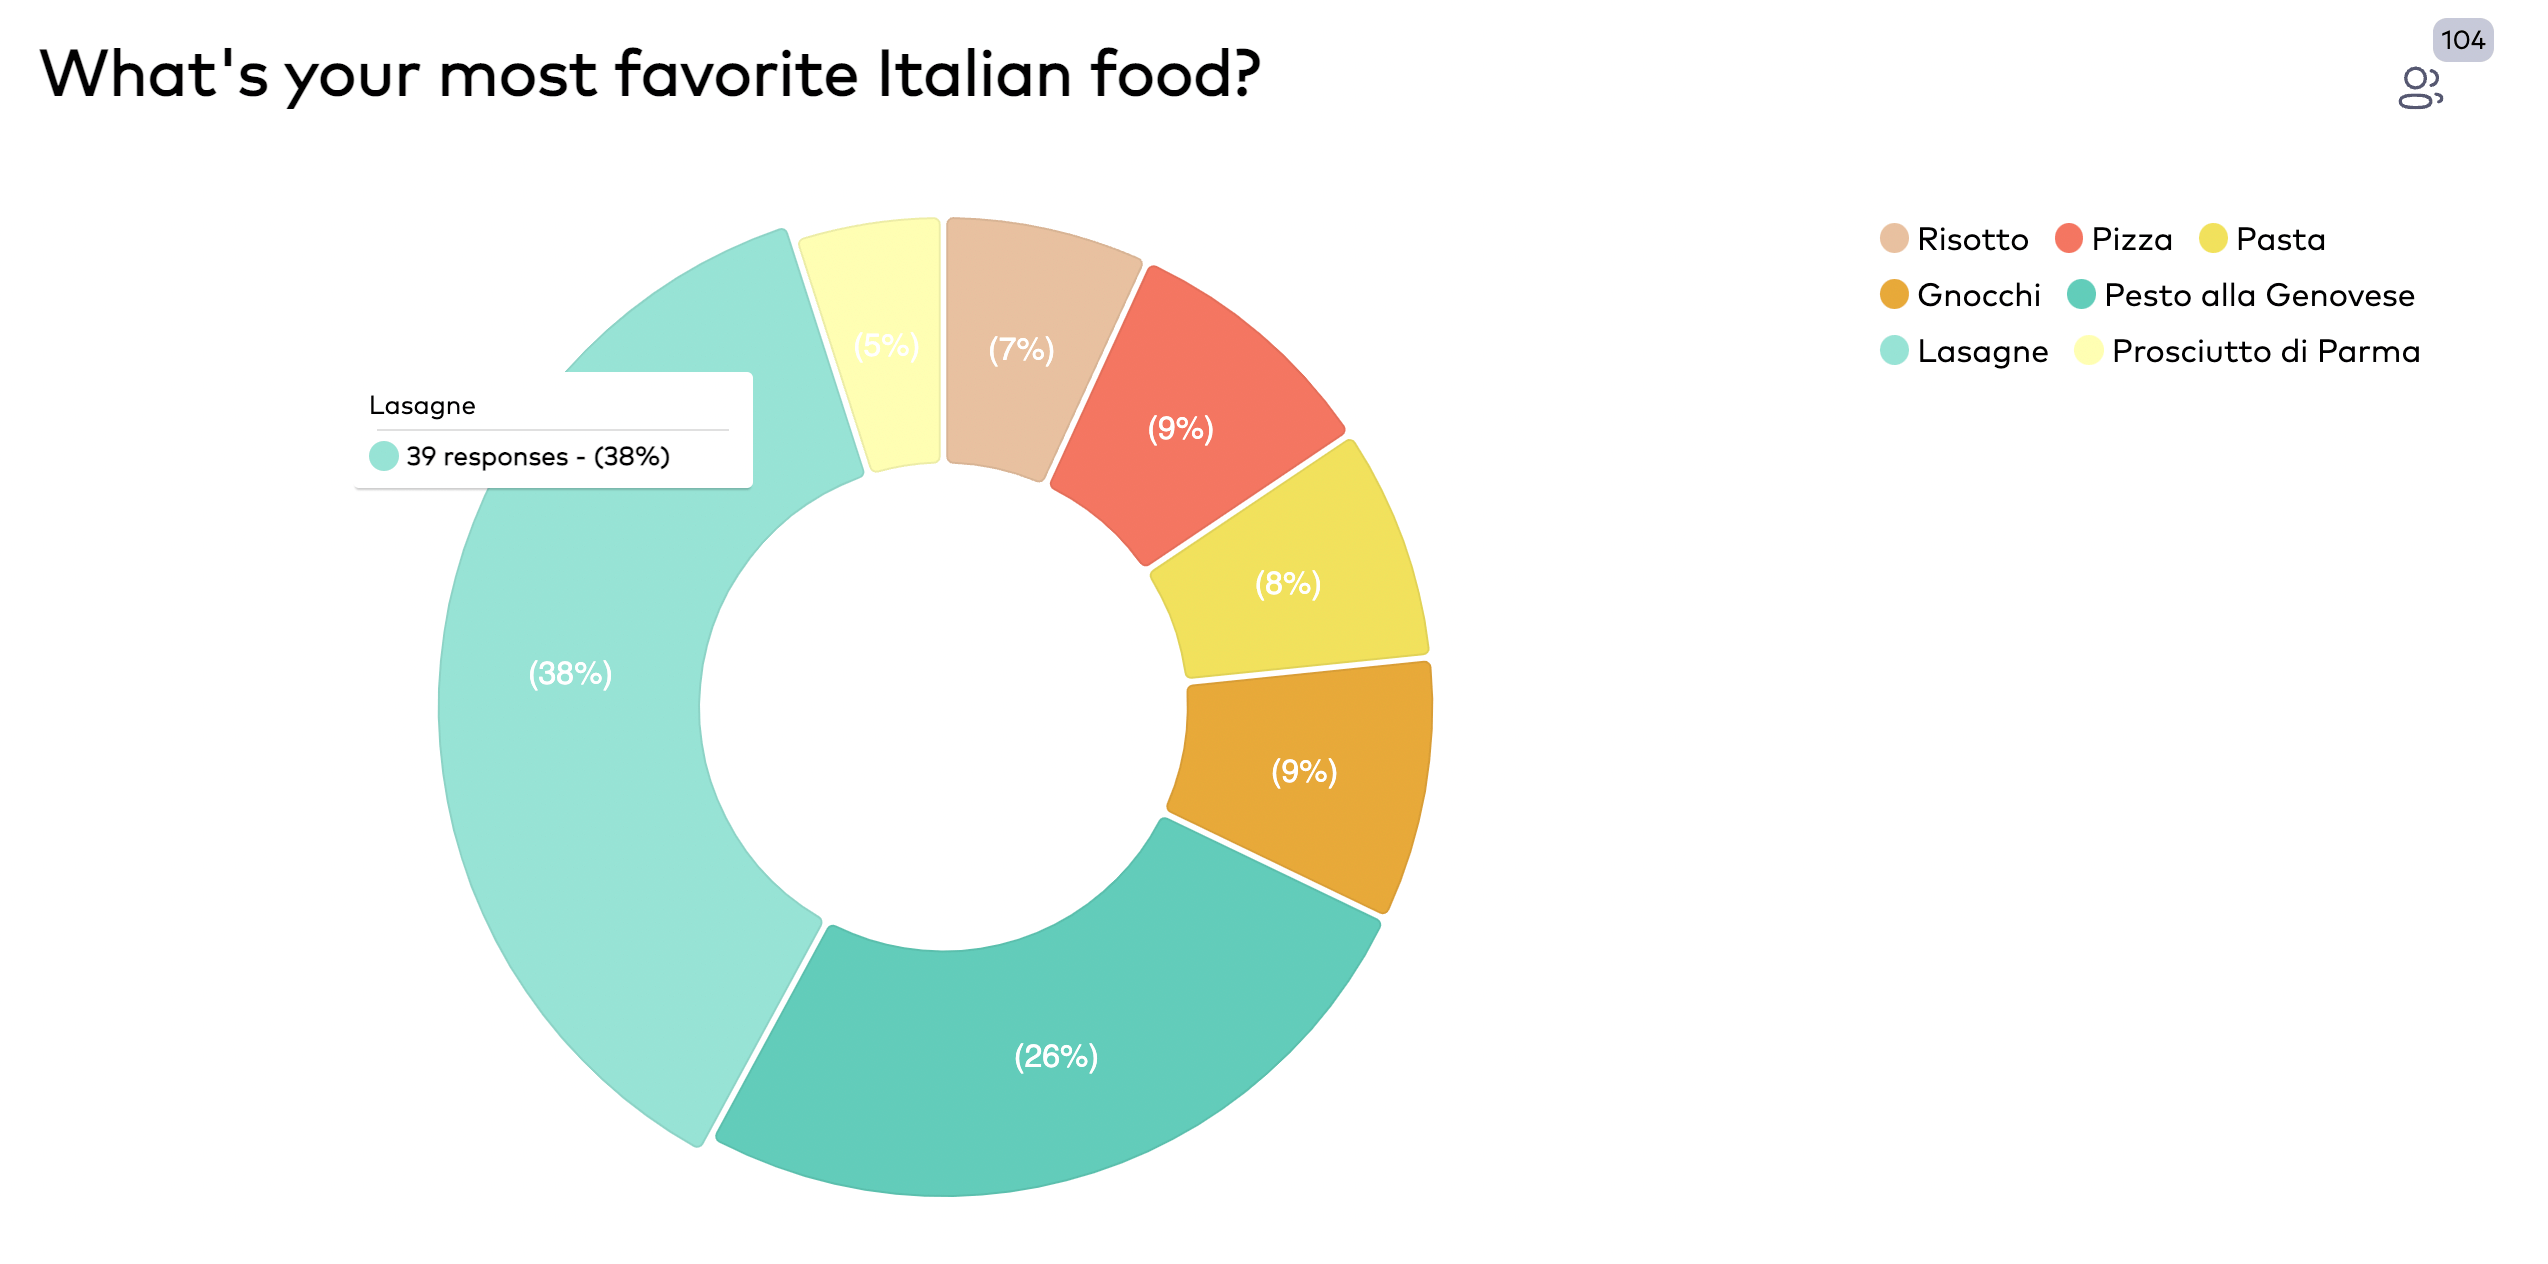
The single-choice field shows various options and lets the user choose zero or one from the list. To force the user to choose one option, you can enable the “Required” toggle on this field.
The chart created for this field is a doughnut chart. It identifies options with different colors and shows the percentage of times users have each option so far. By hovering your mouse over each option in the chart, you can see how many times users have selected it so far.
Multi-Choice Field
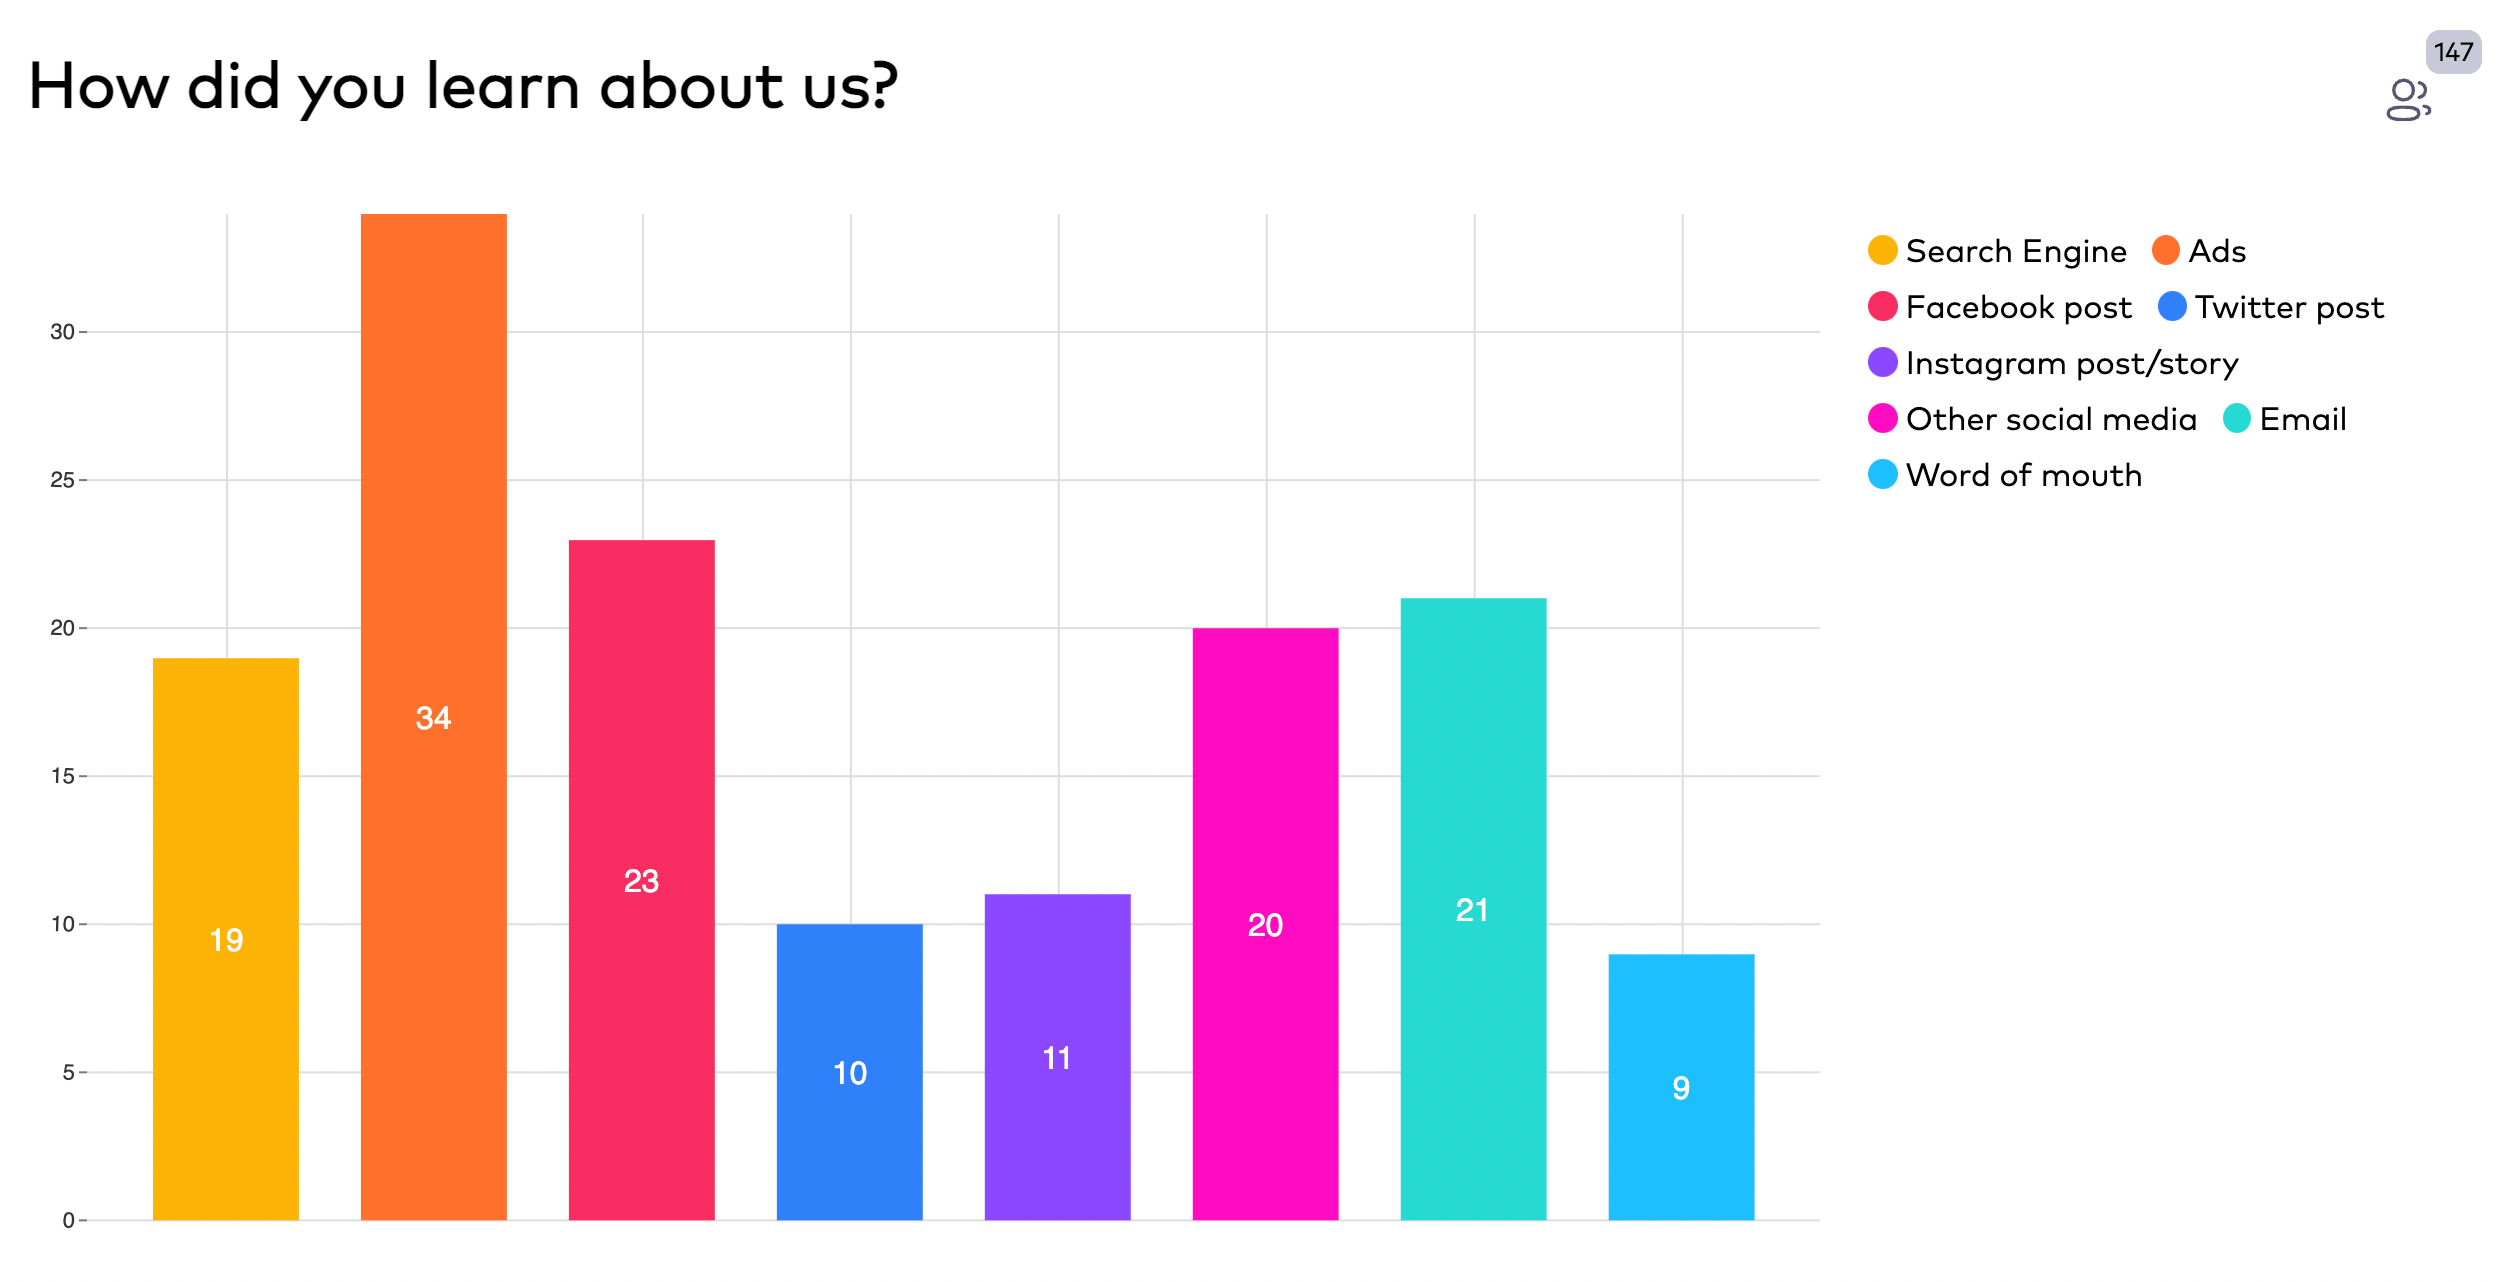
The multi-choice field shows various options and lets the user choose zero or more options from the list. To force the user to choose at least one option, you can enable the “Required” toggle on this field.
The chart created for this field is a column chart. It identifies options with different colors and shows the number of times users have each option so far. By hovering your mouse over each option in the chart, you can see how many users have selected it and also its percentage among other options.
Dropdown Field
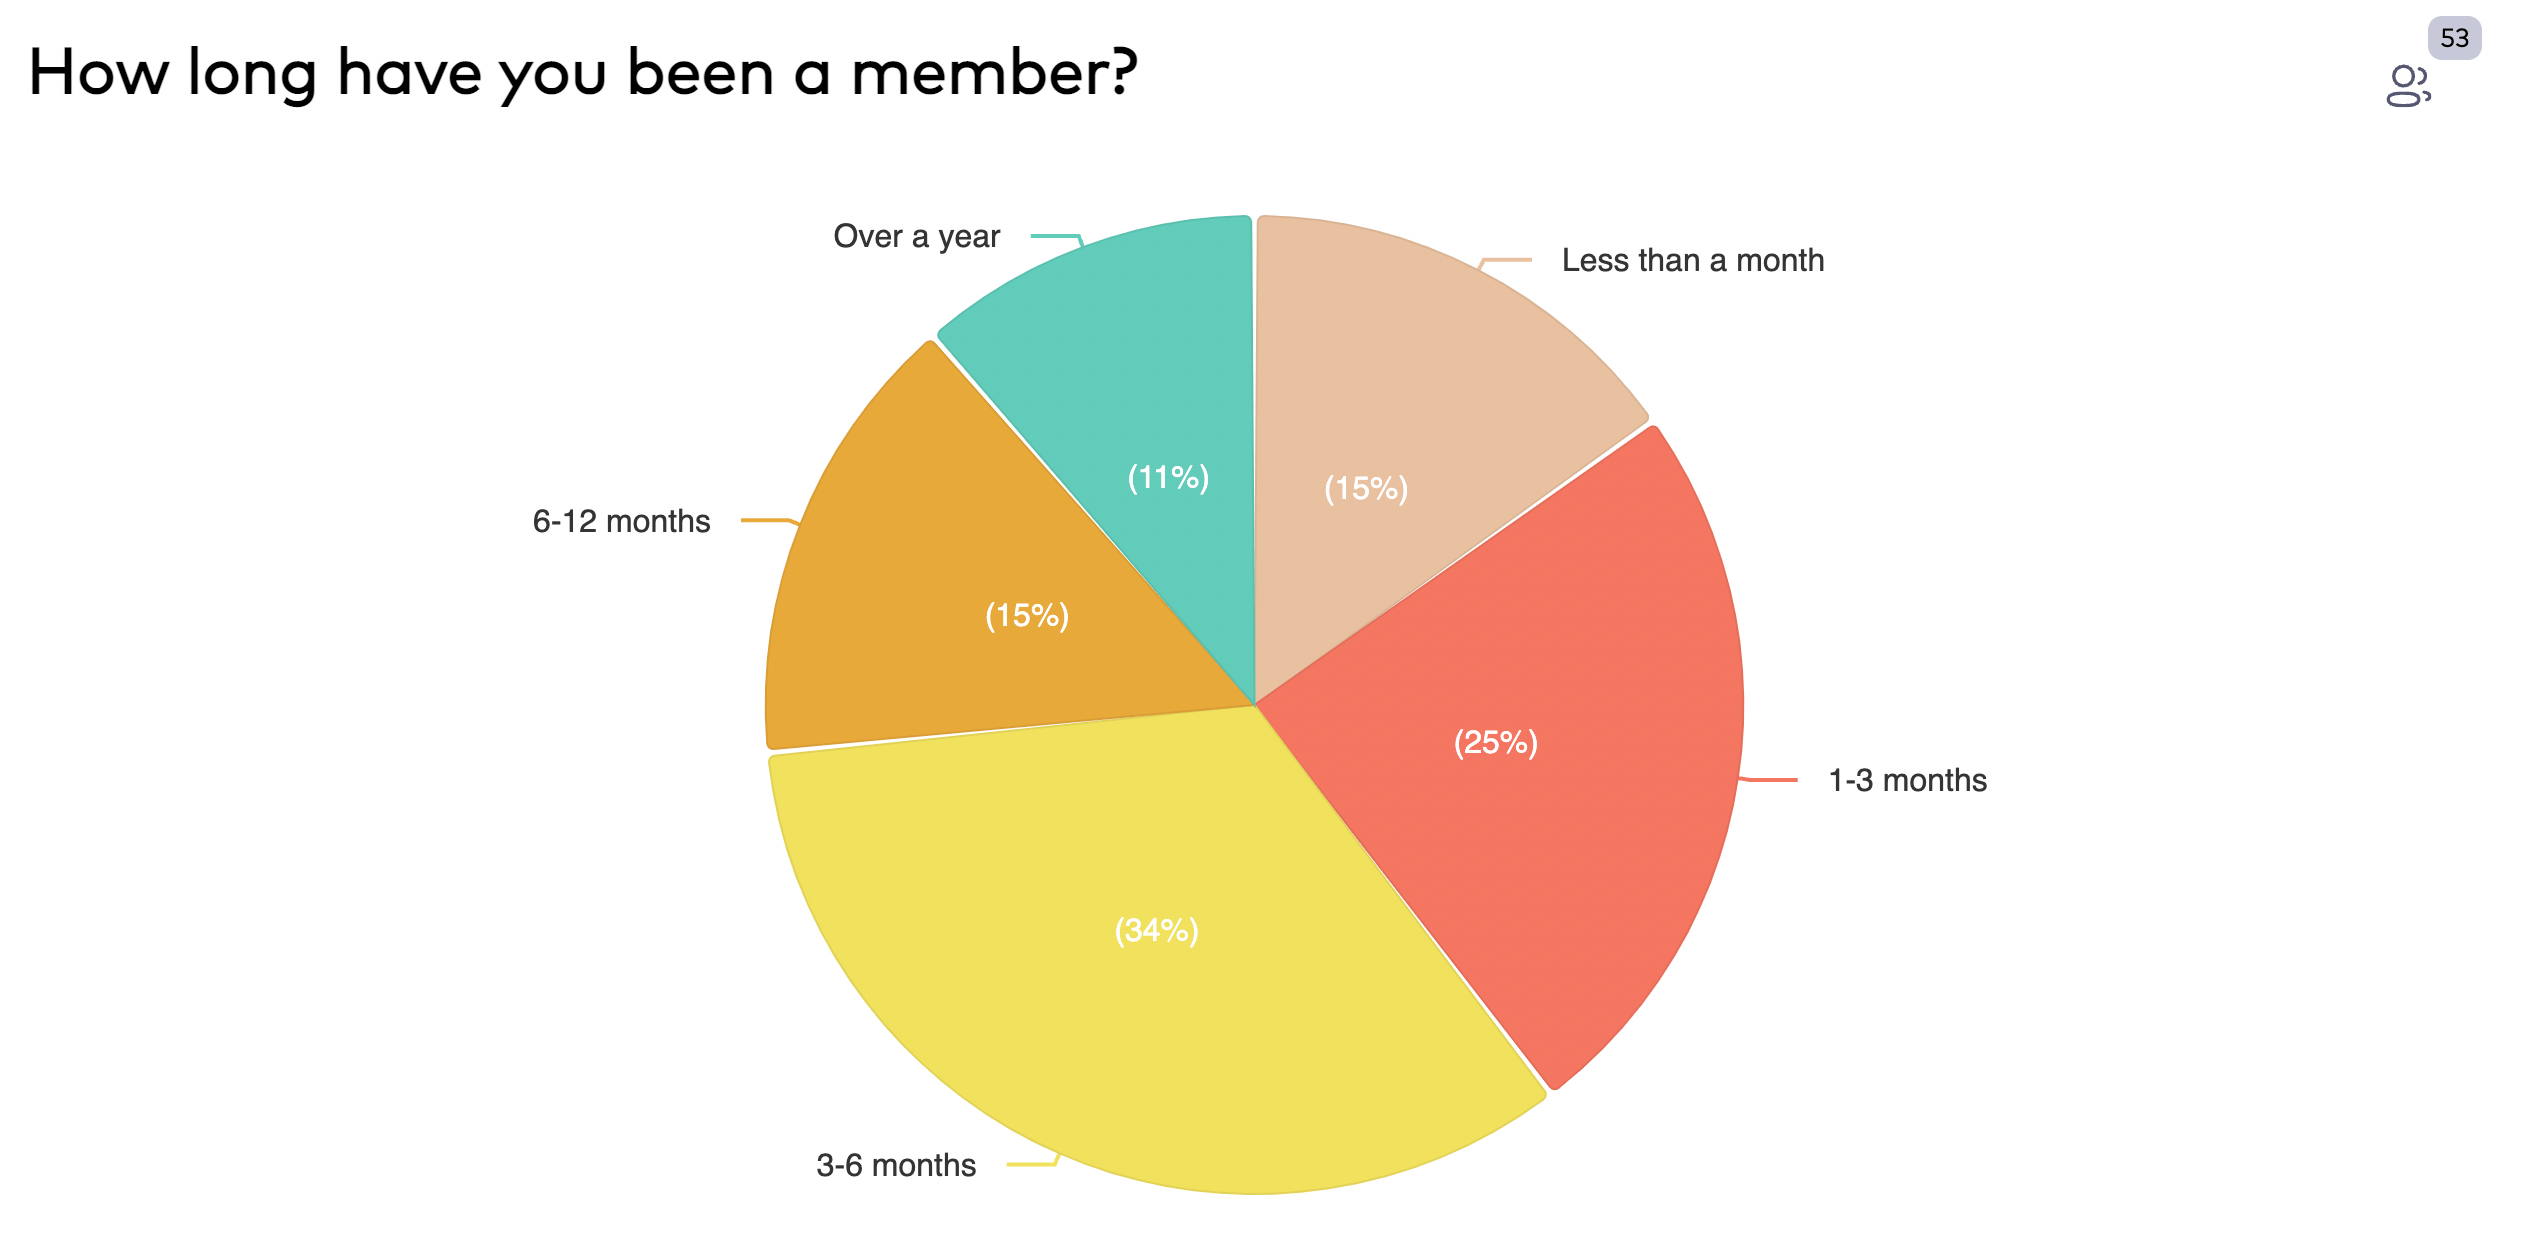
The dropdown field shows various options and lets the user choose zero or one option from the list. To force the user to choose at least one option, you can enable the “Required” toggle on this field.
The chart created for this field is a pie chart. It identifies options with different colors and shows the percentage of times users have each option so far. By hovering your mouse over each option in the chart, you can see how many times users have selected it so far.
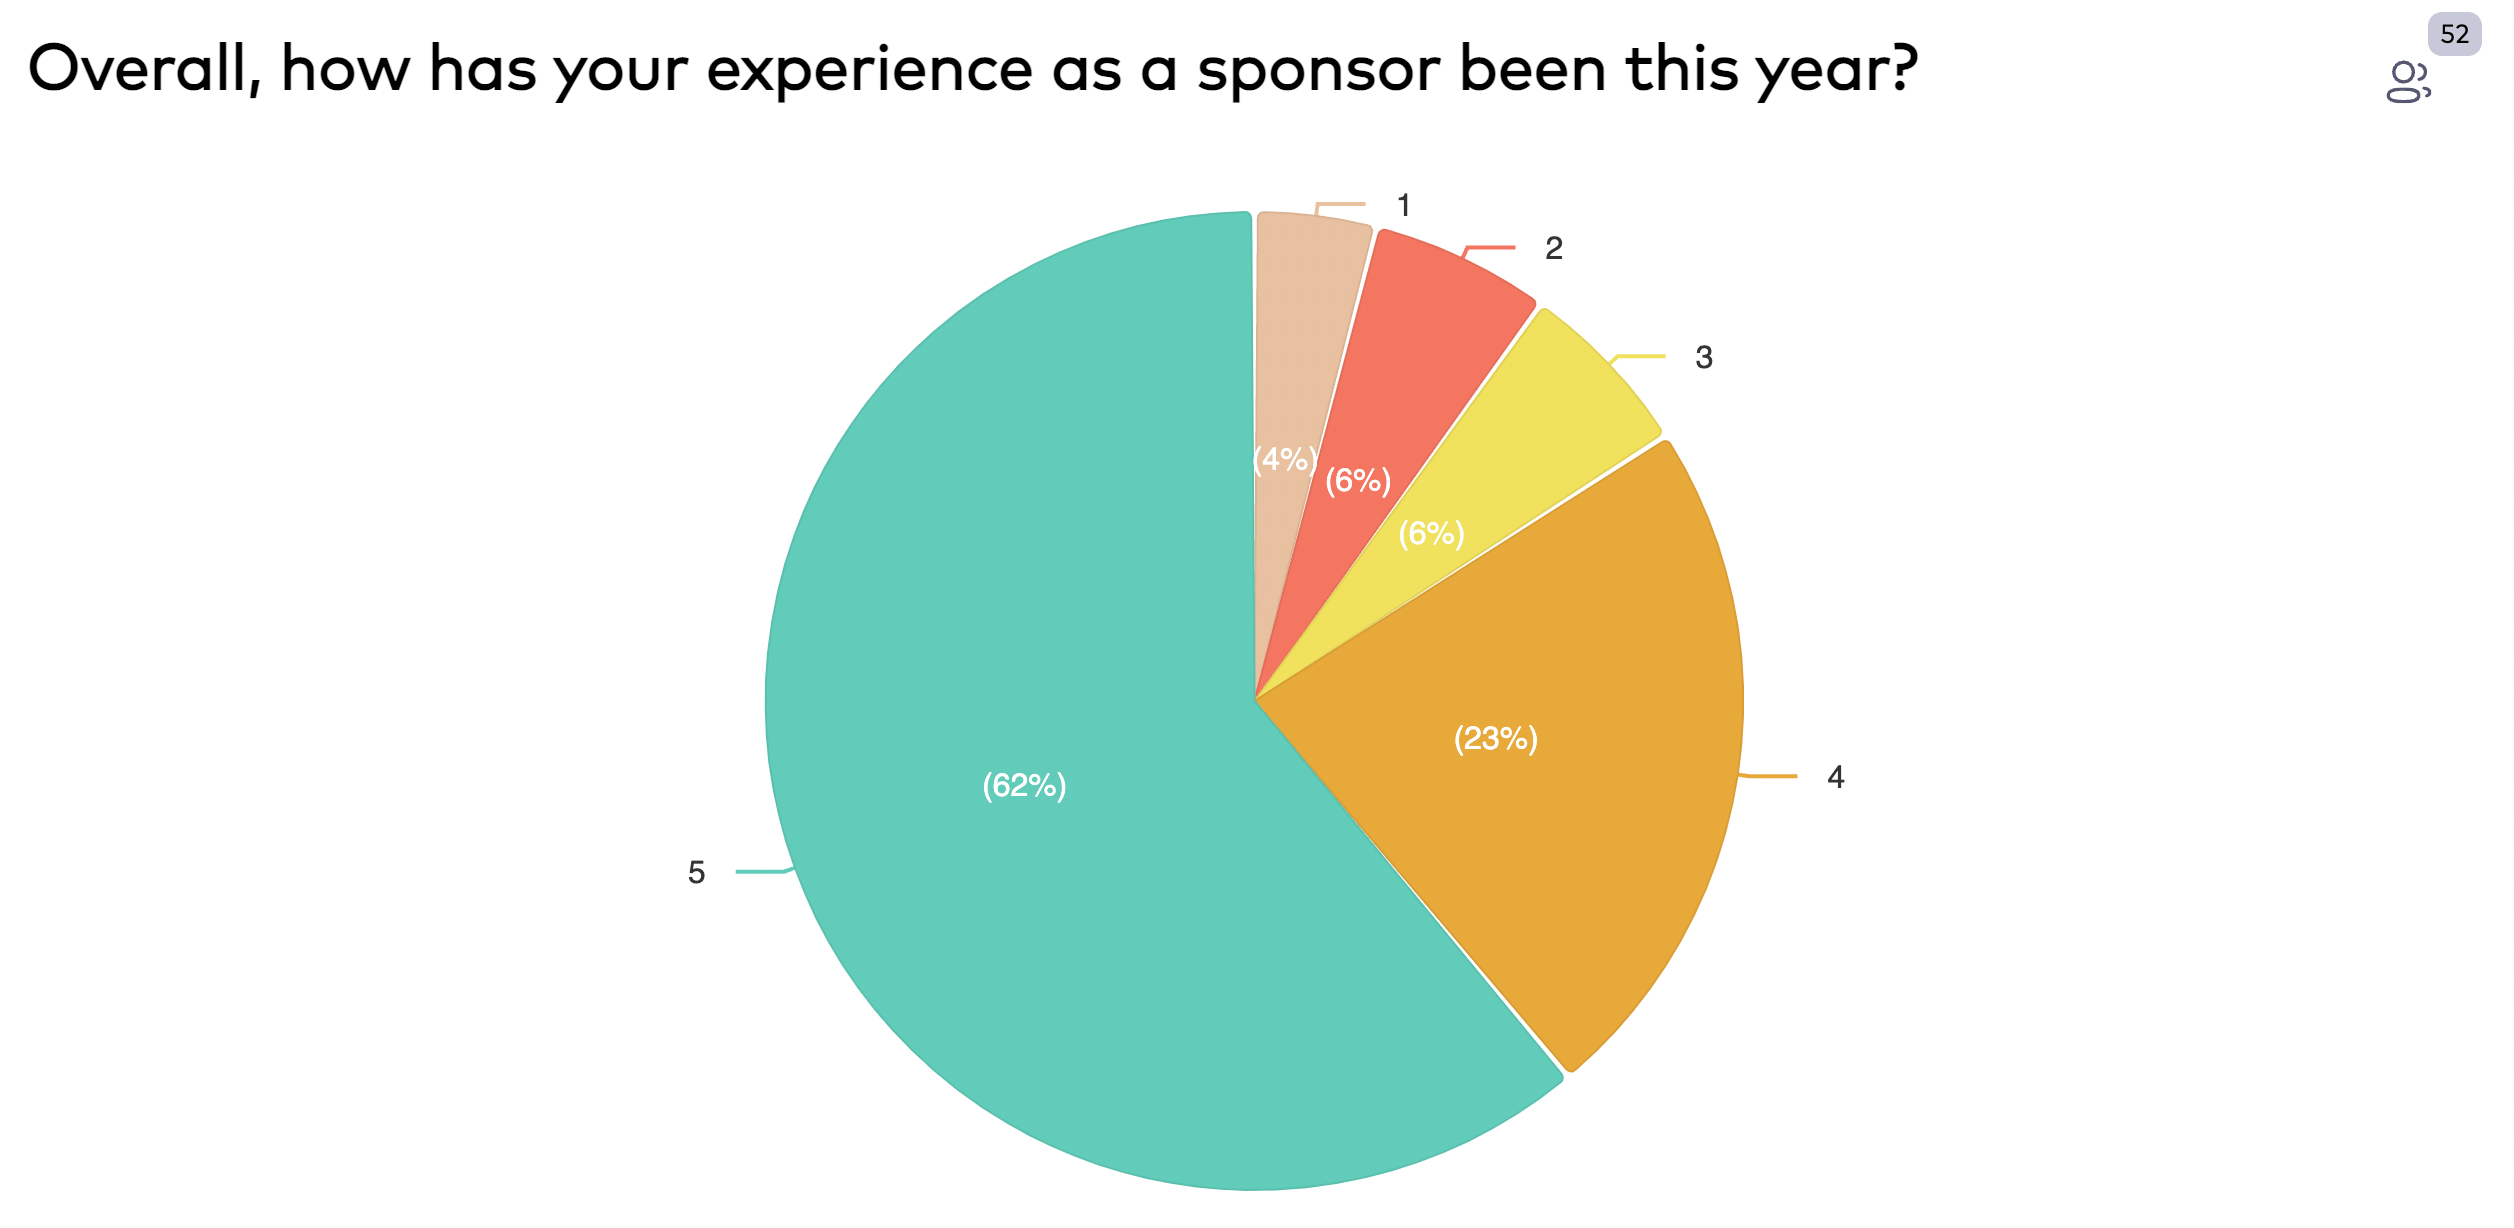
Score 1-10 Field
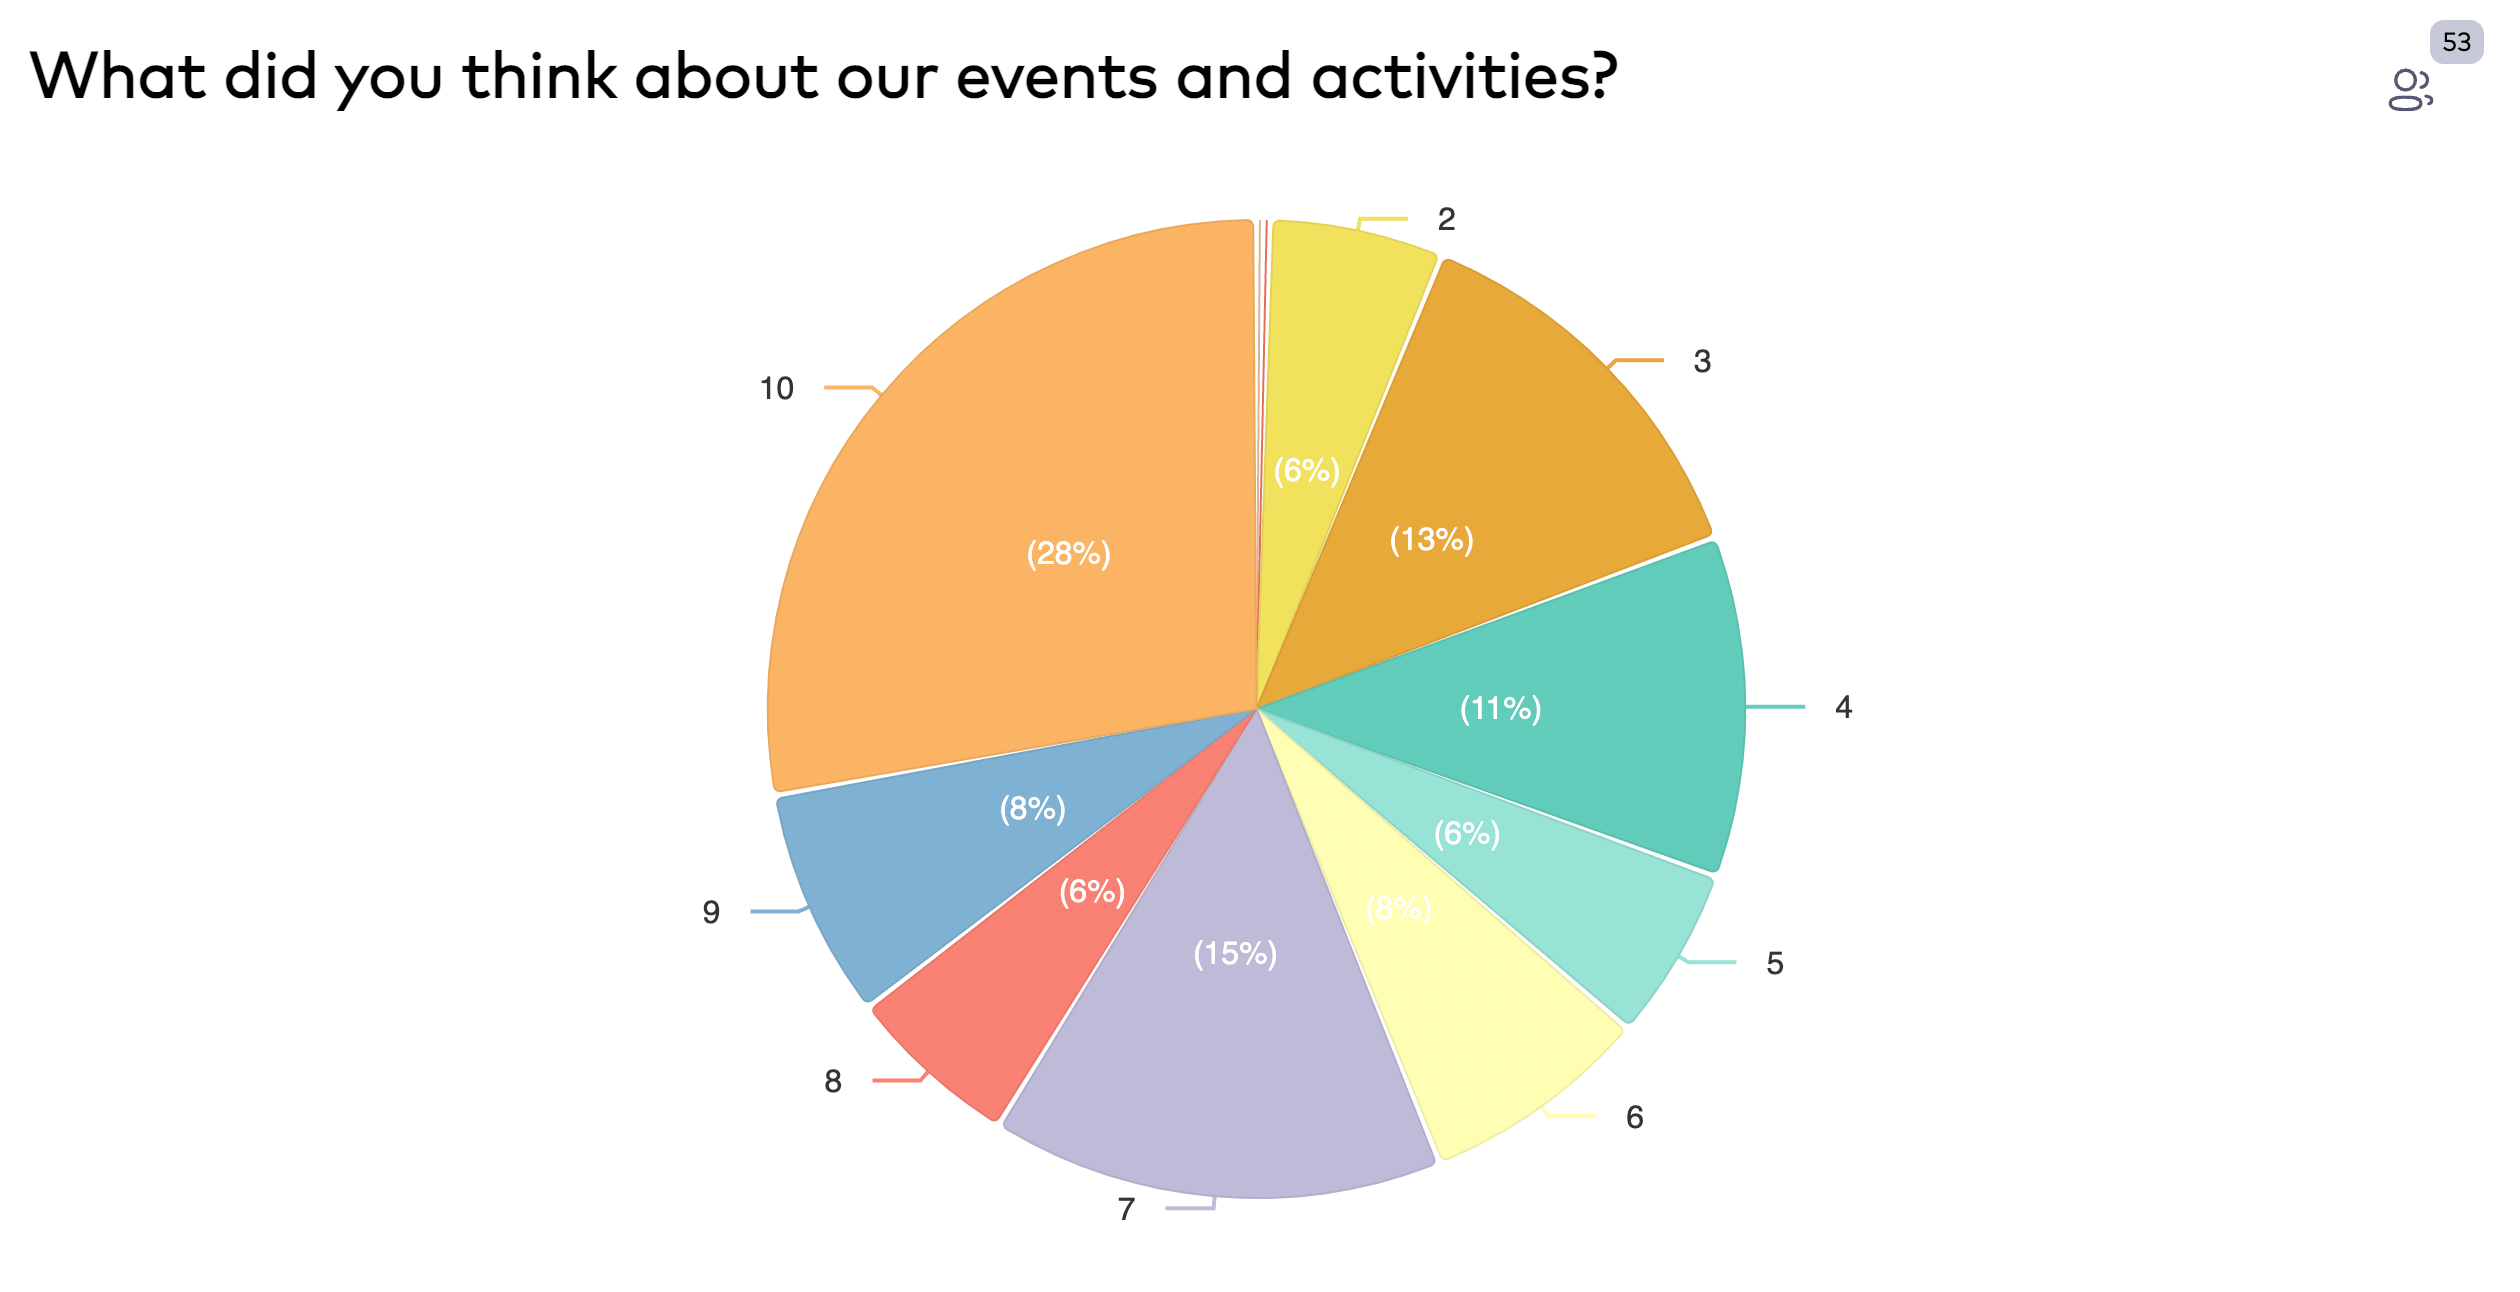
The score field shows a one to ten option and gives the opportunity to the user to rate in this range. To force the user to choose at least one option between one and ten, you can enable the “Required” toggle on this field.
The chart created for this field is a pie chart. It identifies options with different colors and shows the percentage of times users have each option so far. By hovering your mouse over each option in the chart, you can see how many times users have selected it so far.
Formaloo also provides you (as the form’s admin) with an automatically calculated NPS score on this field. To see the NPS score, click on the form in the Formaloo dashboard and switch to the “Charts” tab. Under the score field, you can see the calculated NPS score so far.
SCAT Field
The CSAT field (also known as the Customer Satisfaction field) shows a one to five option and gives the opportunity to the user to rate in this range. It’s usually shown with a five-star image and gives the option to rate between zero stars to five stars. You can also change the image from stars to hearts or other available images.
To force the user to choose at least one option between one and ten, you can enable the “Required” toggle on this field.
The chart created for this field is a pie chart. It identifies options with different colors and shows the percentage of times users have each option so far. By hovering your mouse over each option in the chart, you can see how many times users have selected it so far.
Formaloo also provides you (as the form’s admin) with an automatically calculated average rating score on this field. To see the score, click on the form in the Formaloo dashboard and switch to the “Charts” tab. Under the CSAT field, you can see the calculated CSAT rating score so far.
Yes/No Field
The Yes/No field performs like the single-choice field. It produces a doughnut chart that identifies options with different colors and shows the percentage of times users have each option so far. By hovering your mouse over each option in the chart, you can see how many times users have selected it so far.
Like/Dislike Field
The Like/Dislike field too performs like the single-choice field. It produces a pie chart that identifies options with different colors and shows the percentage of times users have each option so far. By hovering your mouse over each option in the chart, you can see how many times users have selected it so far.
Text Field

The chart on text fields is mostly built for showcasing the entered values. Therefore, it’s only available in the “Presentation Mode” of the forms. This chart shows a word cloud of the entered text values.
By hovering your mouse over each text value in the chart, you can see how many times users have entered it so far.
What’s next?
Charts are amazing, letting us understand our collected data by visualizing it. In this article, we went through the charts that are created for each field type. But this is not the end for us. Formaloo charts are evolving. The next version of charts gives you the ability to build reports and customize the charts without any code!
Also, with the upcoming web app builder, you can create apps that showcase forms, charts, reports, tables, links, and much more all in a single app.