
How to build an employee performance & engagement dashboard
Create a live HR dashboard to track employee performance, satisfaction, and engagement trends across your organization in real time.

Turn employee data into actionable insights
In this guide, you’ll build a central HR dashboard to measure performance scores, engagement levels, and satisfaction trends. You’ll collect data through feedback and evaluation forms, connect them to a unified database, and visualize results using tables, charts, and linked views.
📘 Learn more: Create your first form, app, or portal in a flash
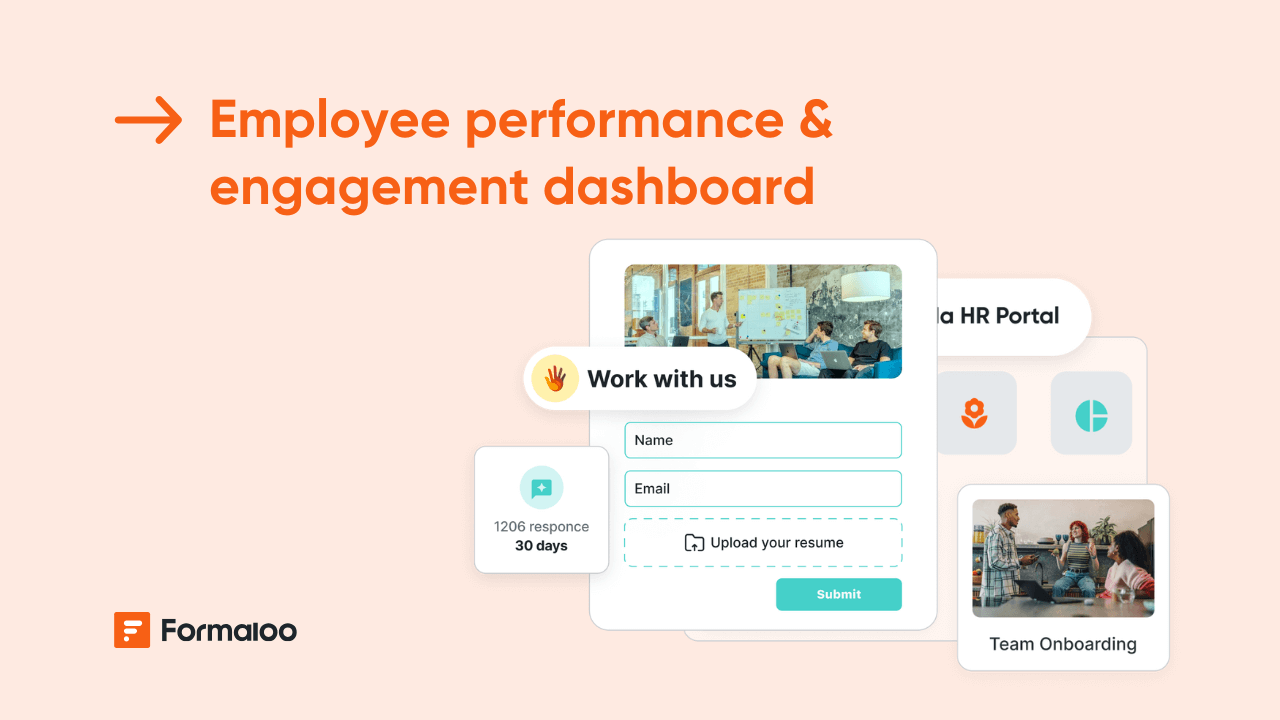
Step 1 — Create your performance review and engagement forms
Start from your workspace and click + New → Form. You can start from scratch or select ready-made HR templates such as Employee Performance Evaluation Survey or Employee Engagement Survey from the Template gallery.
Or, use Magic Create, simply describe what you need (e.g., “A form to collect performance ratings, goals, and engagement feedback from employees”).
Why this matters: collecting consistent feedback and ratings ensures reliable data for your dashboard.
📘 Learn more: How to create a form
Step 2 — Add key performance and engagement fields
Include a mix of quantitative and qualitative fields to capture a full picture:
- Employee name, department, role
- Manager name (dropdown)
- Goal achievement score (1–10)
- Team collaboration rating
- Employee satisfaction level
- Feedback or suggestions (long text)
💡 Tip: use rating and numeric fields for easy aggregation and visualization later.
📘 Learn more: Form editor and field types
Step 3 — Calculate overall performance scores
Use variable fields to automatically combine multiple ratings into a total score.
Example formula:
(@goal_score + @team_score + @communication_score) / 3
Then, display the result as “Overall performance score” for clarity.
Why this matters: consistent scoring makes comparison and ranking effortless.
📘 Learn more: How to add and calculate scores using variable fields
Step 4 — Connect multiple forms for a unified dashboard
If you’re using separate forms (e.g., Engagement Survey and Performance Review), connect them through linked rows to match each employee’s data across forms.
Example setup:
- Employee Directory (main database)
- Linked Engagement Form
- Linked Performance Form
Why this matters: it ensures each employee’s insights stay organized and accessible in one place.
📘 Learn more: What are linked rows and how to use them
Step 5 — Visualize data in dashboards
Open your project’s Results → Responses tab, and start visualizing your data:
- Table view to browse employee details and scores.
- Chart blocks to show engagement or satisfaction averages.
- Kanban view grouped by performance status (Excellent, Good, Needs Improvement).
- Filter controls for departments or review cycles.
📘 Learn more: How to showcase charts based on form responses
Step 6 — Build your HR portal for collaboration
From your project, create an Employee Insights Portal.
Add pages such as:
- Performance dashboard (with linked charts and tables)
- Engagement trends
- Employee profiles (linked to individual submissions)
Restrict access to HR managers or leadership, so only authorized users can view sensitive data.
📘 Learn more: How to create a portal and manage users’ access
Step 7 — Automate reporting and alerts
Go to Settings → Advanced logic or Notify in your form:
- Send automatic alerts when an employee’s score drops below a threshold.
- Email managers monthly summaries of their team’s engagement.
- Use AI Email Assistant to auto-generate personalized summaries or recommendations.
📘 Learn more: How to create and send custom email templates
Step 8 — Analyze results and uncover trends with AI
Activate AI Analyze to surface insights from all your employee feedback:
- Detect recurring themes (e.g., workload, recognition).
- Highlight departments with declining satisfaction.
- Generate natural-language summaries for leadership reports.
📘 Learn more: Uncover insights and trends in your data with AI Analyze
Step 9 — Share dashboards securely
Once your dashboard is ready:
- Share it privately with management through your portal.
- Or share a public view link for company-wide transparency.
- Add your logo and banner for a polished HR presentation.
📘 Learn more: How to customize your portal with your brand identity
Pro tips
- Link surveys quarterly to track progress over time.
- Use AI Smart Content to generate automated recommendations for employees.
- Export filtered data to Sheets for extended HR analytics.
📘 Learn more: How to connect Google Sheets to your forms
Example scenario
Every quarter, employees complete an Engagement Survey and a Performance Review. Formaloo calculates total scores automatically, syncs both forms to the Employee Directory, and updates your dashboard. Charts visualize engagement trends, and managers receive instant alerts when any score drops below 6.
📘 Learn more: How to create an employee performance evaluation survey
FAQ
- Can I compare engagement across multiple teams?
Yes, add a department field and filter or chart results by team. - Can I track changes over time?
Absolutely. Use date fields and AI Analyze to compare quarterly or yearly trends. - Can employees view their own data?
Yes, through login-enabled portals with personalized visibility.
📘 Learn more: How to let users view and edit their own data in your portal
Your HR insights system is live, keep evolving it
You’ve built a connected dashboard that visualizes performance and engagement data in real time. Keep refining your surveys and dashboards to continuously measure, improve, and celebrate employee growth.
📘 Learn more: Build personalized and time-saving flows with logic, automations, and AI
Last updated October 2025


